Climate Change Indicators: Drought
https://www.epa.gov/climate-indicators/climate-change-indicators-drought
https://www.epa.gov/climate-indicators/climate-change-indicators-drought
Environmental Protection Agency
Learn more about Teaching Climate Literacy and Energy Awareness»
Grade Level
Regional Focus
Climate Literacy
This Static Visualization builds on the following concepts of Climate Literacy.
Click a topic below for supporting information, teaching ideas, and sample activities.
Notes From Our Reviewers
The CLEAN collection is hand-picked and rigorously reviewed for scientific accuracy and classroom effectiveness.
Read what our review team had to say about this resource below or learn more about
how CLEAN reviews teaching materials
Teaching Tips | Science | Pedagogy |
Technical Details
Teaching Tips
- It would be beneficial to develop learning activities around the visualization to facilitate student learning.
- For more information on temperature trends look at the related URL for the graphics "A Closer Look: Temperature and Drought in the Southwest."
About the Content
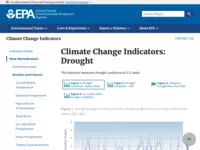
- This resource focuses on observed changes in drought conditions across the US.
- There are two graphics that display how drought severity has changed over time.
- One graphic shows the average conditions for time period 1895-2015 and the looks closer at the recent period from 2000-2015.
- Detailed explanations of the science and interpretations are found in the background section below the graphics.
About the Pedagogy
- This resource from the EPA is a useful compendium that explains and illustrates the relationship between climate change and weather through observed data. This page focuses on US drought conditions and trends.
- The static visuals are varied and easy to read and understand. There are descriptions beneath the graphics that discusses the depicted data.
- There are key points about the interpretations of the graphics, background information on drought and climate, and links to more information on the data below the graphics.
Technical Details/Ease of Use
- Very easy to access and view online. Website also provides PDFs of all graphs and information for downloading.
