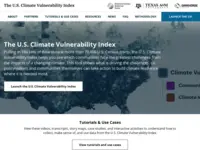
The U.S. Climate Vulnerability Index
https://climatevulnerabilityindex.org/
https://climatevulnerabilityindex.org/
Environmental Defense Fund, Texas AM University, and Darkhorse Analytics
Learn more about Teaching Climate Literacy and Energy Awareness»
Grade Level
Regional Focus
Online Readiness
Topics
Climate Literacy
This Simulation/Interactive builds on the following concepts of Climate Literacy.
Click a topic below for supporting information, teaching ideas, and sample activities.
Notes From Our Reviewers
The CLEAN collection is hand-picked and rigorously reviewed for scientific accuracy and classroom effectiveness.
Read what our review team had to say about this resource below or learn more about
how CLEAN reviews teaching materials
Teaching Tips | Science | Pedagogy |
Technical Details
Teaching Tips
- Teachers may wish to introduce this tool to students using the short videos included in the "Tutorials & Use Cases" section.
- This resource could be introduced at the beginning of a unit on climate change vulnerability and again at the end so that students can understand how each factor adds up to a total vulnerability score.
- The target audience for this tool is policymakers, and students can explore this tool in a social studies unit to understand how scientific information can be used to support policy decisions.
- Highlighting and discussing which regions of the country are most vulnerable and why could be a valuable topic to explore with students.
About the Content
- This interactive mapping tool allows students to explore a variety of factors (environmental, social, economic, and infrastructure effects on neighborhood-level stability) that contribute to an overall climate vulnerability score.
- This tool uses 184 sets of data to provide a detailed report that students can use to understand what factors contribute to climate vulnerability in a precise location.
- This high-quality tool also uses census data to further refine climate risk to a particular zip code. This activity is updated "regularly" per the FAQ page, however there is no explicit publishing date.
- This tool uses high quality data to help users understand local, state, and national climate vulnerability. It is well-designed and scientifically accurate.
- Passed initial science review - expert science review pending.
About the Pedagogy
- This resource is a stand-alone tool with no formal teacher guide, however, a use guide can help students explore a particular region or factor of interest.
- This tool may be most useful in classrooms where students are already familiar with the compounding effects of social and economic vulnerability to climate change. This tool will appeal to learners that appreciate toggling between settings in systems with a large amount of information.
- For other learners, this tool may feel overwhelming unless there is a more focused lesson plan or guiding questions (i.e., which counties in your state are most vulnerable to a certain factor; what factors contribute the most to the climate vulnerability score in your area?)
- This tool enables users to overlay physical, social, and environmental factors to understand vulnerability from a broad perspective.
- It could be woven into science, social science, or social studies classes depending on which factors are chosen and how they are described.
- This resource engages students in using scientific data.
See other data-rich activities
Technical Details/Ease of Use
- A tutorial is provided for users, however the target audience is not necessarily students and therefore no teacher guide is provided.
- Educators will need to familiarize themselves with the tool in order to effectively introduce it to students.
- Educators will also have to construct a lesson plan to implement this tool in a meaningful way.
