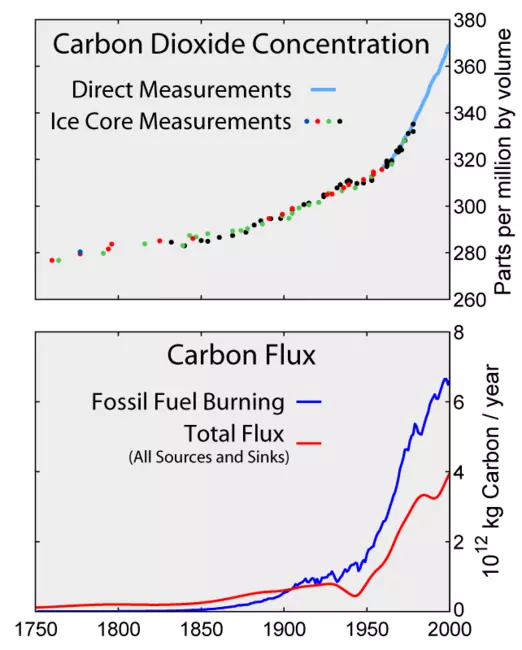
View Original Image at Full SizeThe lower graph shows carbon released from burning fossil fuels and other sources. The upper graph shows the accumulation of CO2 in the atmosphere over the same time scale.
Image by Robert A. Rohde for Global Warming Art
Originally uploaded in CLEAN:Educator Support for Teaching Climate and Energy:Teaching Climate.
Image 188823 is a 800 by 642 pixel WebP
Uploaded:
Jul11 18
Last Modified: 2025-04-10 17:45:00
Permanent URL: https://serc.carleton.edu/download/images/188823/carbon_dioxide_emitted_vs_carbon_di.webp
The file is referred to in 2 pages
Provenance
From Wikimedia Commons, by Robert A. Rohde for Global Warming Art.
ReuseThis item is offered under a Creative Commons Attribution-NonCommercial-ShareAlike license
http://creativecommons.org/licenses/by-nc-sa/3.0/ You may reuse this item for non-commercial purposes as long as you provide attribution and offer any derivative works under a similar license.


