Great Plains: Energy, Water and Land Use - NCA Key Message 1
Summary

![[creative commons]](/images/creativecommons_16.png)
NCA Key Message 1: Energy, Water and Land Use
Visit the full land use and energy page
Rising temperatures are leading to increased demand for water and energy. In parts of the region, this will constrain development, stress natural resources, and increase competition for water among communities, agriculture, energy production, and ecological needs.
1. Guiding Questions
- What options does the Great Plains have to secure a water supply for their future? Who will they get this resource from?
- Today, 80% of the land in the great plains is used for agriculture. What do you think that percentage will be in 50 years? Why?
- What will be the results of more dry days and higher temperatures across the Plains?
- What is happening with water supplies in the southern Plains?
2. Key figures
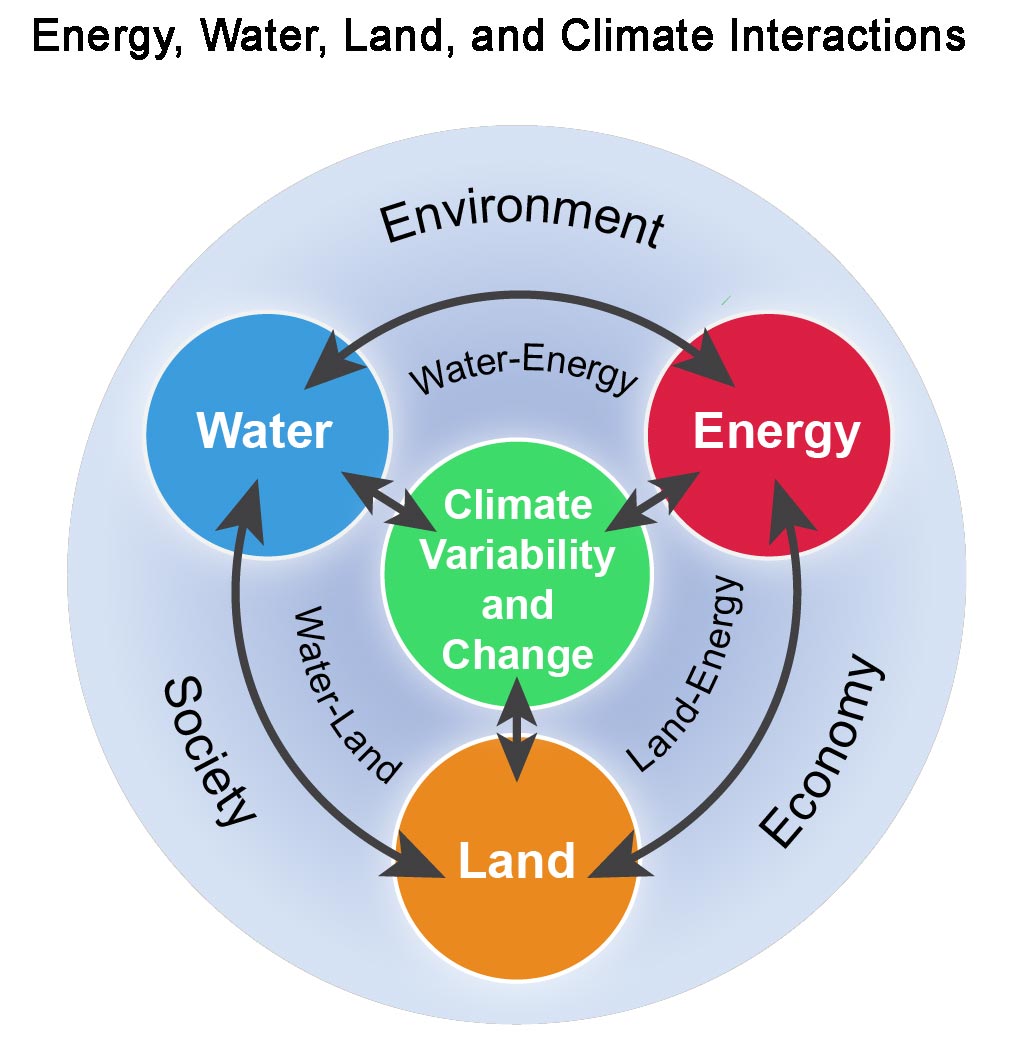
Energy, Water, Land, and Climate Interaction
The interactions between and among the energy, water, land, and climate systems take place within a social and economic context.
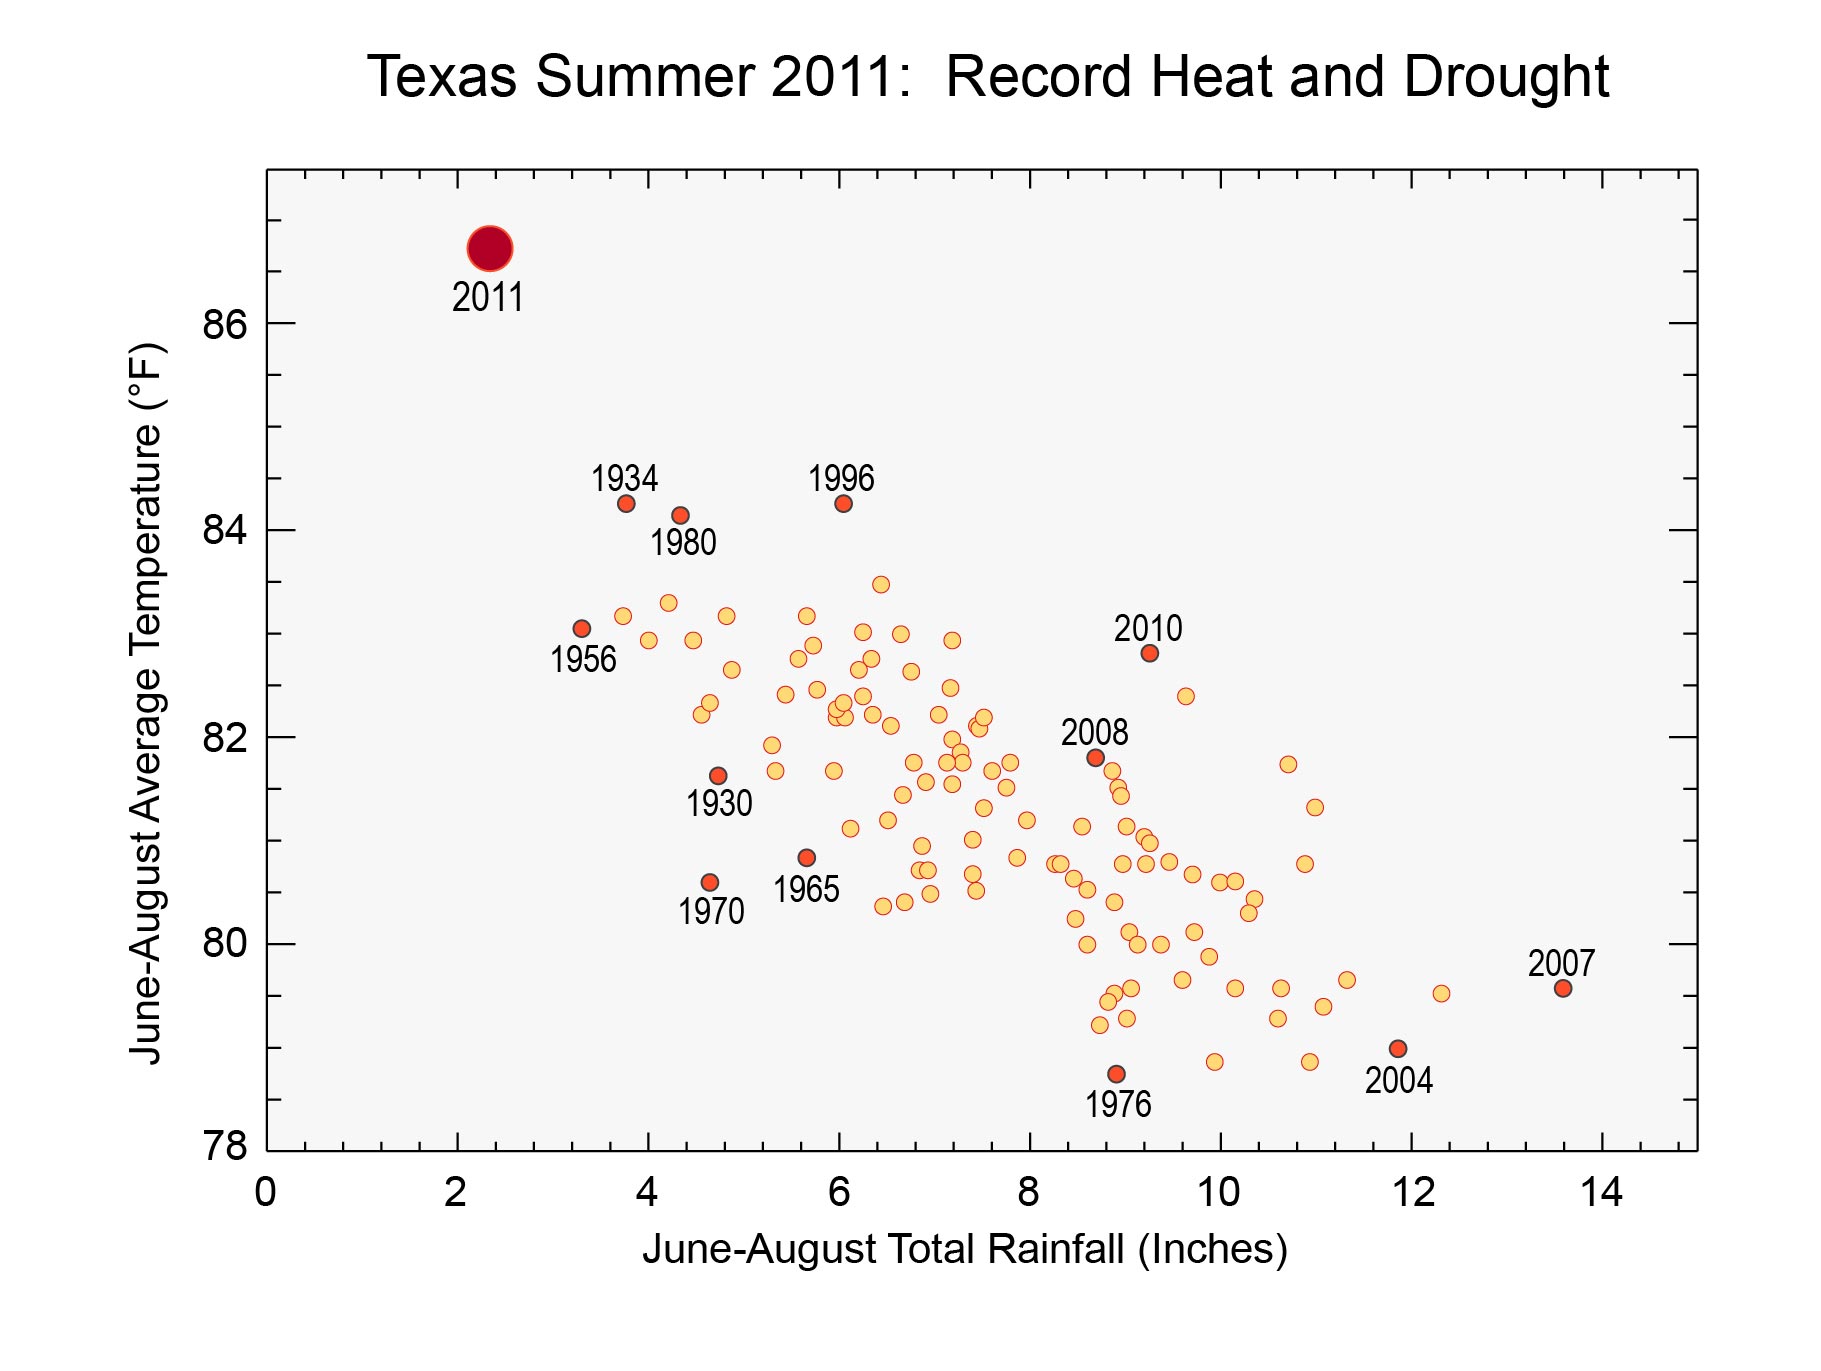
Texas Summer 2011: Record Heat Drought
Graph shows average summer temperature and total rainfall in Texas from 1919 through 2012. The red dots illustrate the range of temperatures and rainfall observed over time. The record temperatures and drought during the summer of 2011 (large red dot) represent conditions far outside those that have occurred since the instrumental record began.4 An analysis has shown that the probability of such an event has more than doubled as a result of human-induced climate change.
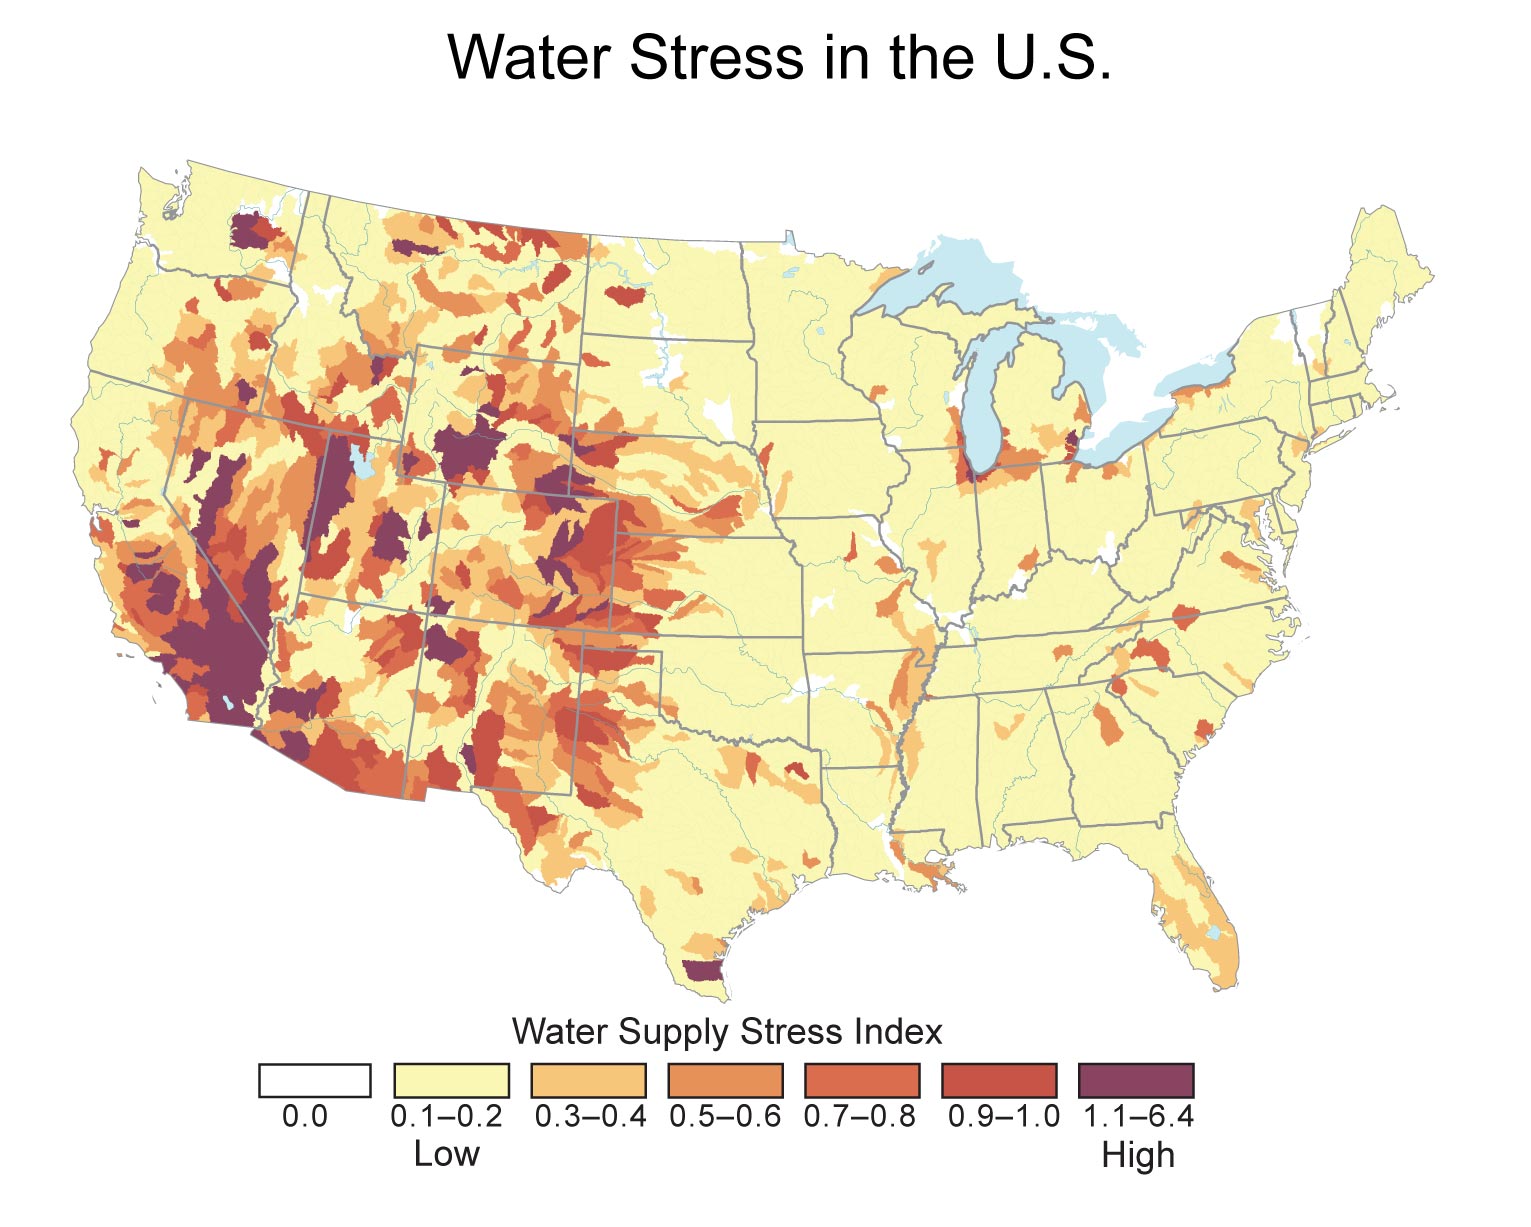
Water Stress in the U.S.
In many parts of the country, competing demands for water create stress in local and regional watersheds. Map shows a "water supply stress index" for the U.S. based on observations, with widespread stress in much of the Southwest, western Great Plains, and parts of the Northwest. Watersheds are considered stressed when water demand (from power plants, agriculture, and municipalities) exceeds 40% (water supply stress index of 0.4) of available supply.
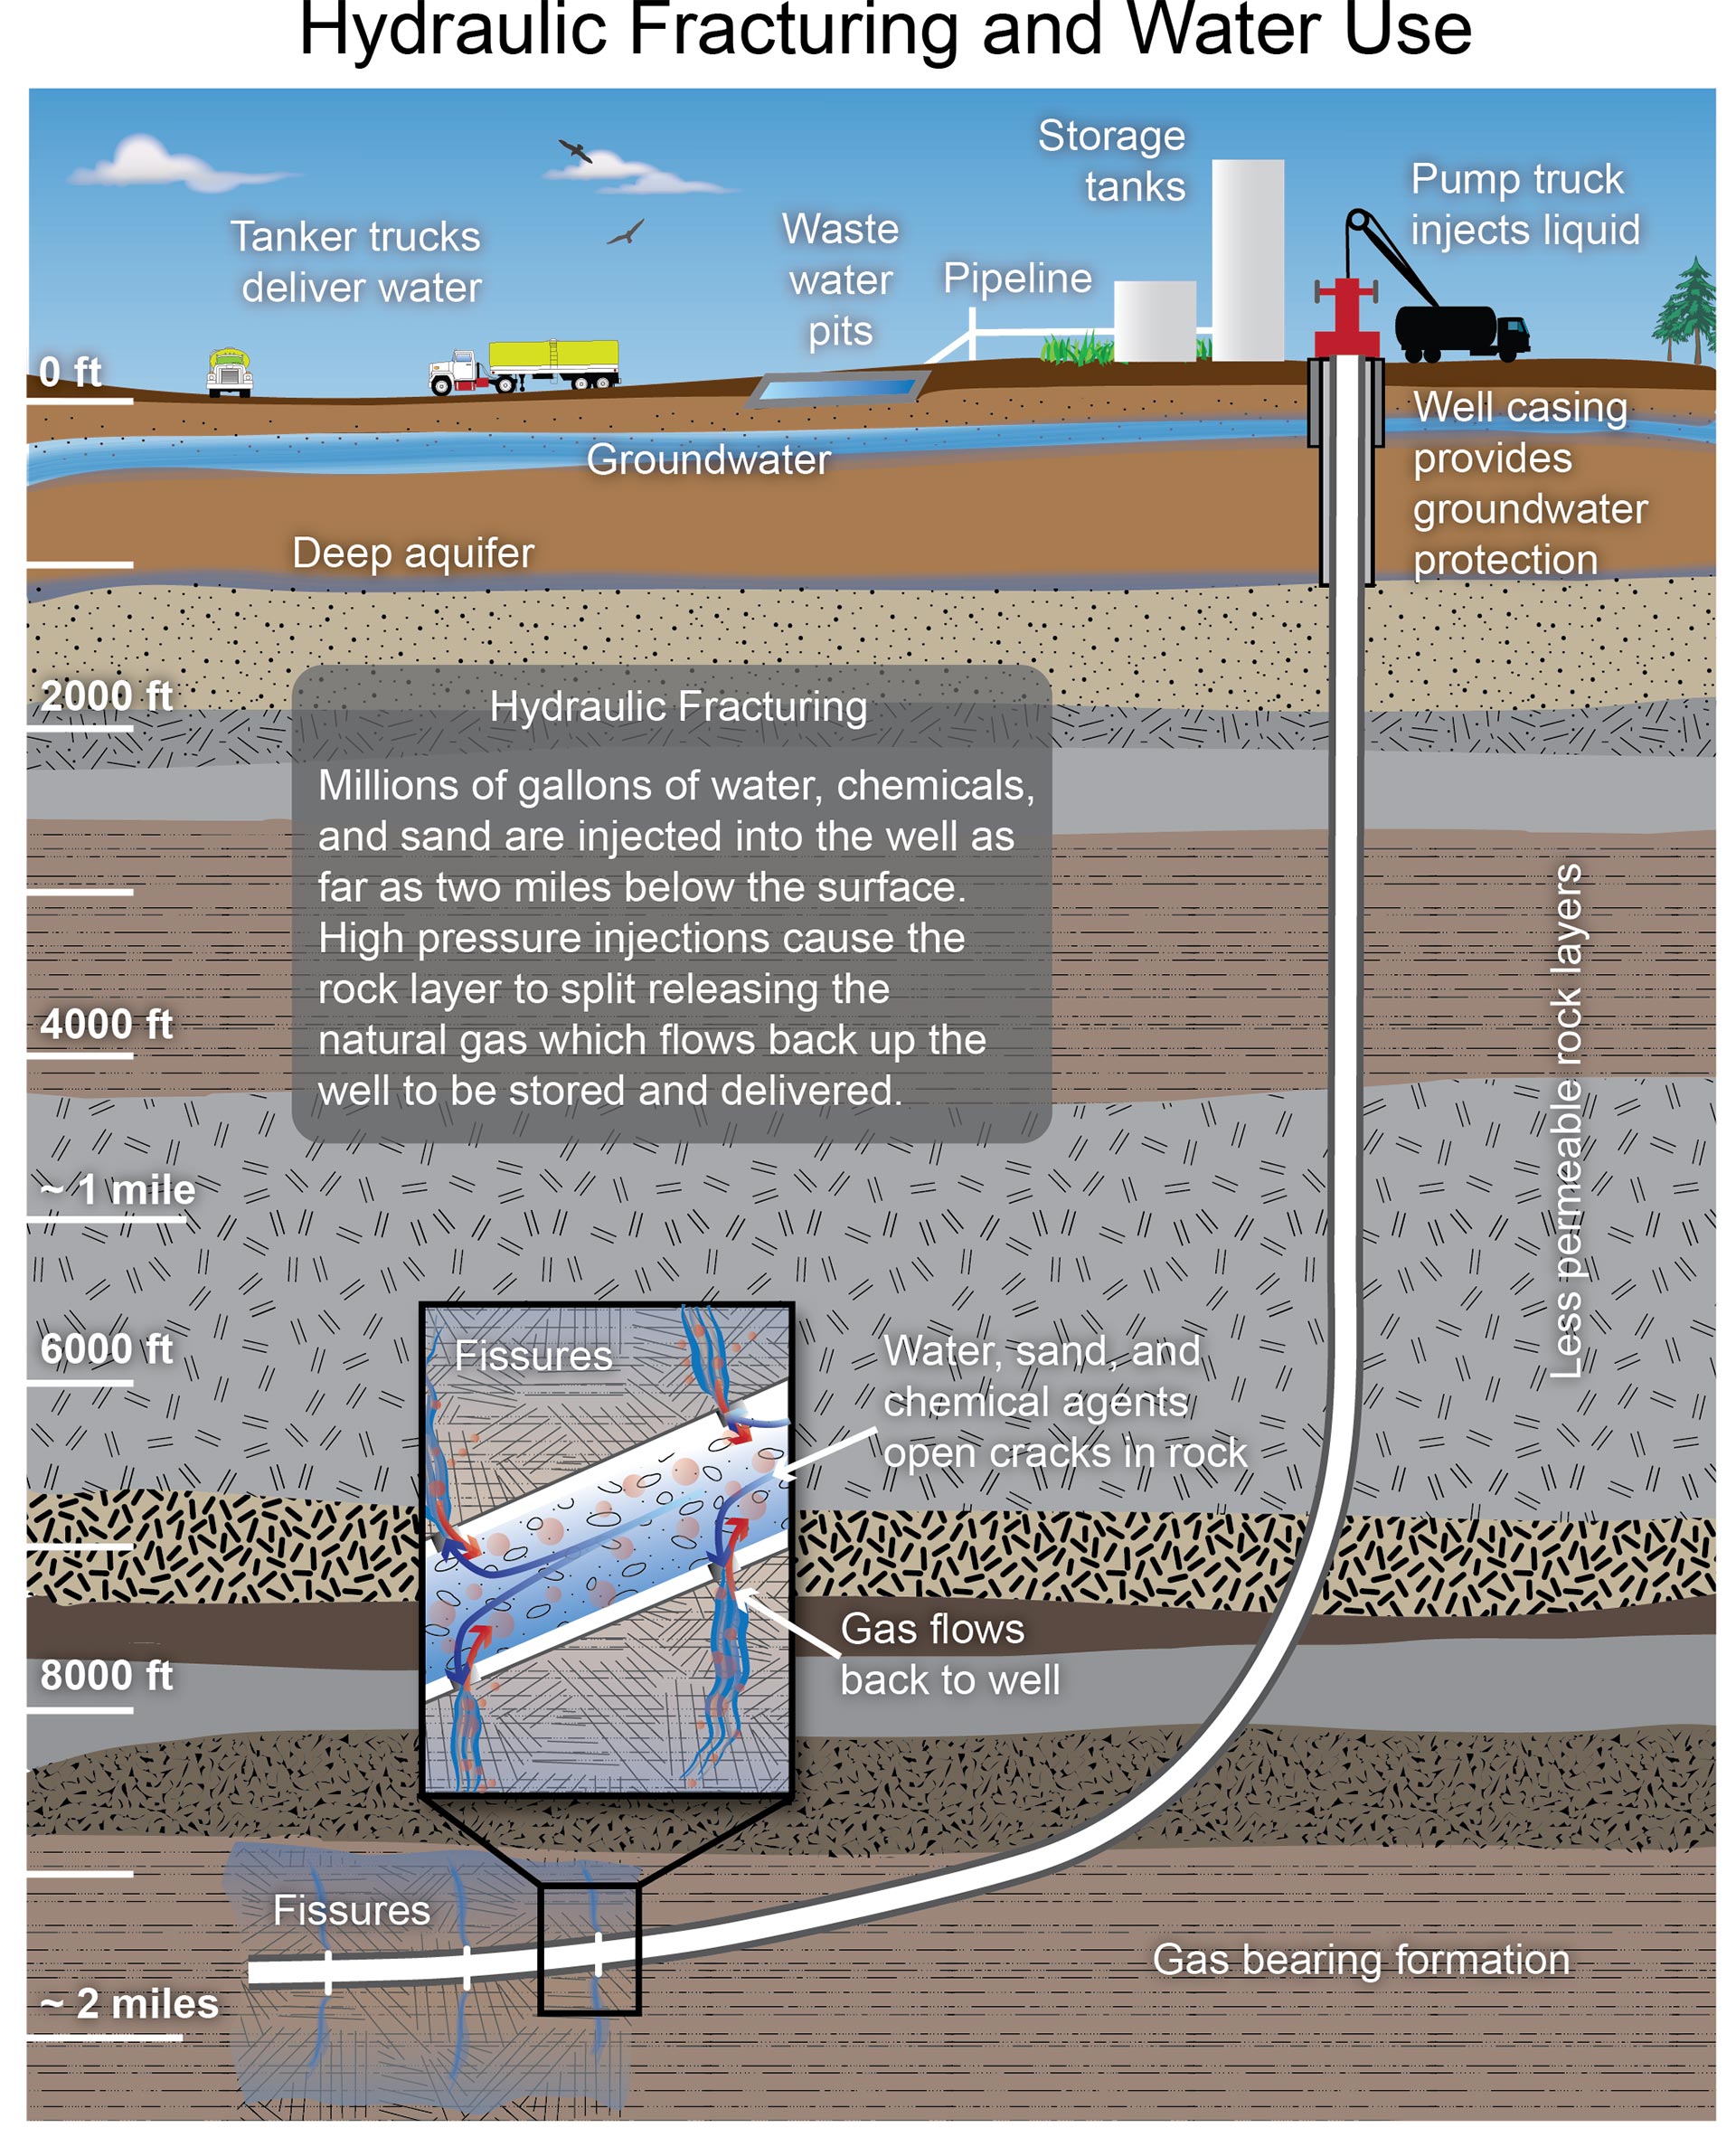
Hydraulic Fracturing and Water Use
Hydraulic fracturing, a drilling method used to retrieve deep reservoirs of natural gas, uses large quantities of water, sand, and chemicals that are injected at high pressure into horizontally-drilled wells as deep as 10,000 feet below Earth's surface. The pressurized mixture causes the rock layer to crack. Sand particles hold the fissures open so that natural gas from the shale can flow into the well. Questions about the water quantity necessary for this extraction method as well as the potential to affect water quality have produced national debate
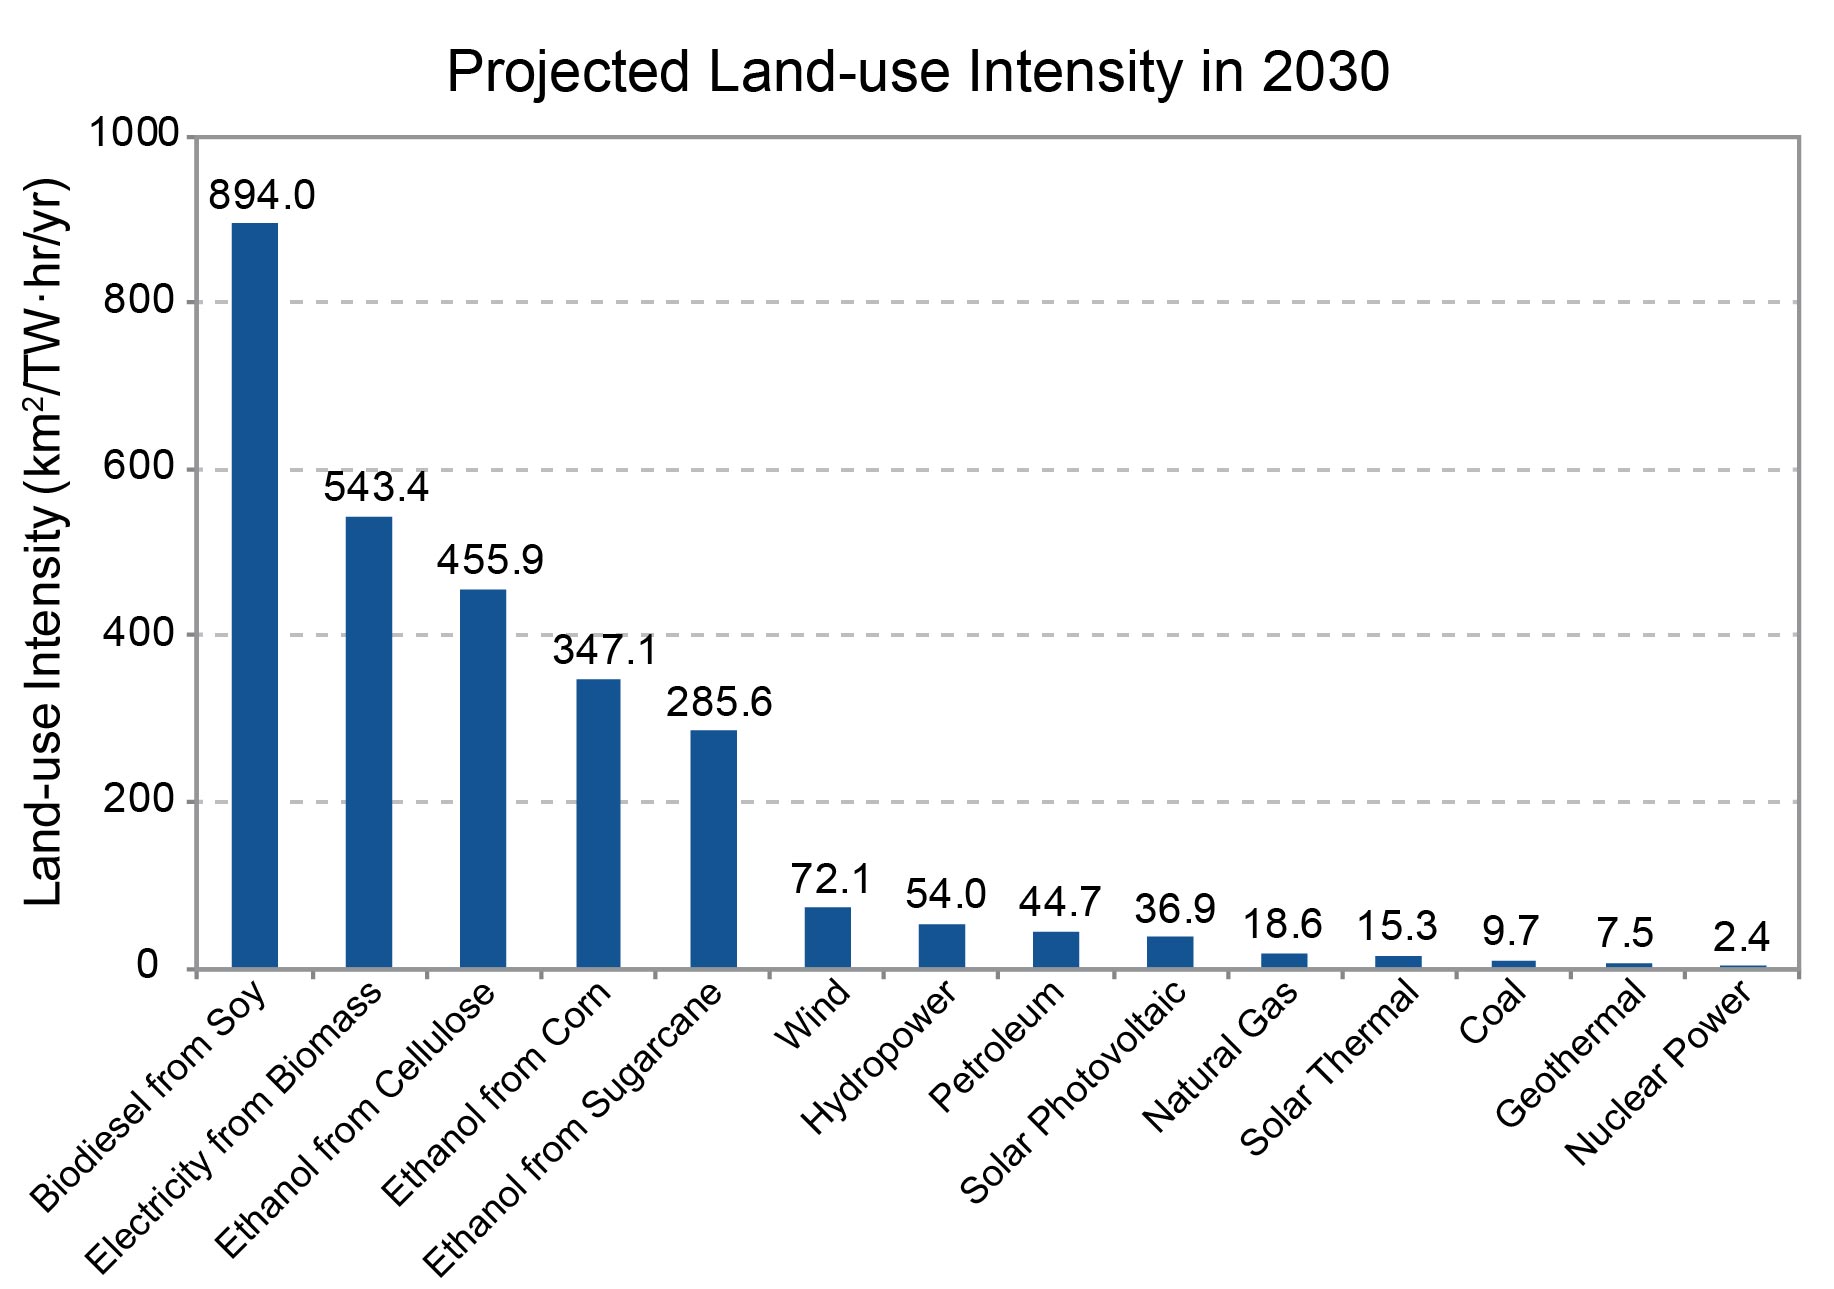
Projected Land-use Intensity in 2030
The figure shows illustrative projections for 2030 of the total land-use intensity associated with various electricity production methods. Estimates consider both the footprint of the power plant as well as land affected by energy extraction. There is a relatively large range in impacts across technologies. For example, a change from nuclear to wind power could mean a significant change in associated land use. For each electricity production method, the figure shows the average of a most-compact and least-compact estimate for how much land will be needed per unit of energy. The figure uses projections from the Energy Information Administration Reference scenario for the year 2030, based on energy consumption by fuel type and power plant "capacity factors" (the ratio of total power generation to maximum possible power generation). The most-compact and least-compact estimates of biofuel land-use intensities reflect differences between current yield and production efficiency levels and those that are projected for 2030 assuming technology improvement
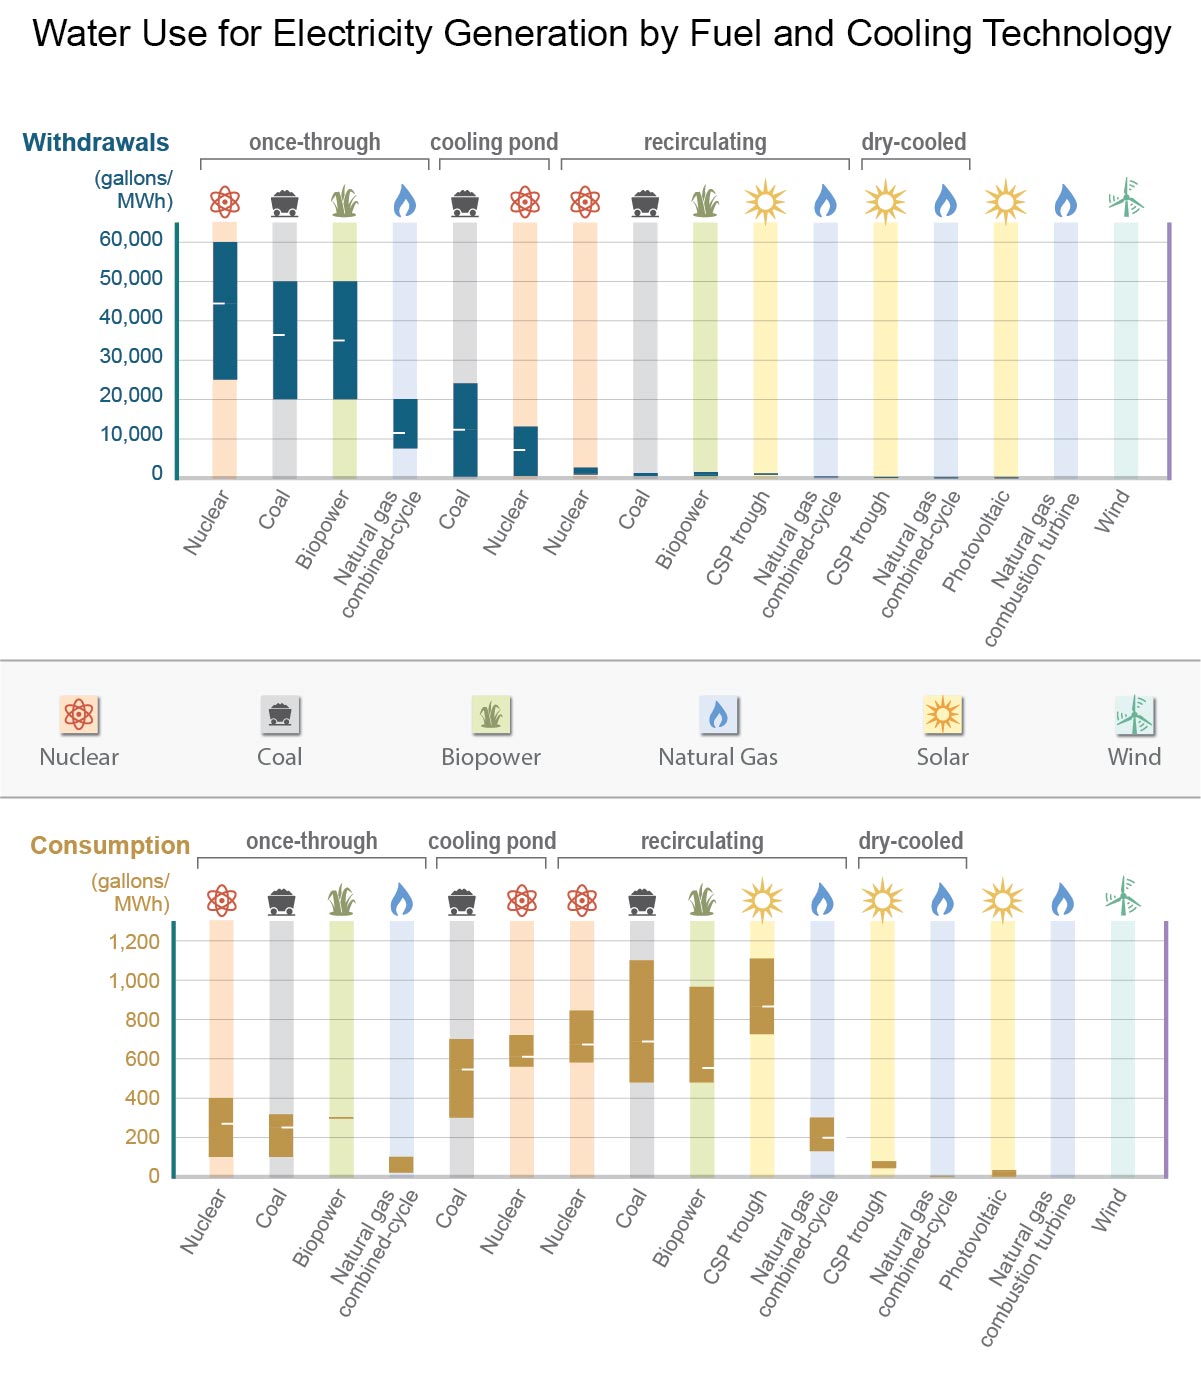
Water Use for Electricity Generation by Fuel and Cooling Technology
Technology choices can significantly affect water and land use. These two panels show a selection of technologies. Ranges in water withdrawal/consumption reflect minimum and maximum amounts of water used for selected technologies. Carbon dioxide capture and storage (CCS) is not included in the figures, but is discussed in the text. The top panel shows water withdrawals for various electricity production methods. Some methods, like most conventional nuclear power plants that use "once-through" cooling systems, require large water withdrawals but return most of that water to the source (usually rivers and streams). For nuclear plants, utilizing cooling ponds can dramatically reduce water withdrawal from streams and rivers, but increases the total amount of water consumed. Beyond large withdrawals, once-through cooling systems also affect the environment by trapping aquatic life in intake structures and by increasing the temperature of streams.26 Alternatively, once-through systems tend to operate at slightly better efficiencies than plants using other cooling systems. The bottom panel shows water consumption for various electricity production methods. Coal-powered plants using recirculating water systems have relatively low requirements for water withdrawals, but consume much more of that water, as it is turned into steam. Water consumption is much smaller for various dry-cooled electricity generation technologies, including for coal, which is not shown. Although small in relation to cooling water needs, water consumption also occurs throughout the fuel and power cycle.27
Regional Water, Energy, and Land Use, with Projected Climate Change Impacts
U.S. regions differ in the manner and intensity with which they use, or have available, energy, water, and land. Water bars represent total water withdrawals in billions of gallons per day (except Alaska and Hawai'i, which are in millions of gallons per day); energy bars represent energy production for the region in 2012; and land represents land cover by type (green bars) or number of people (white and green bars). Only water withdrawals, not consumption, are shown (see Ch. 3: Water). Agricultural water withdrawals include irrigation, livestock, and aquaculture uses.
3. Other Resources
EERE: Clean Energy in My State
Select your state to find energy efficiency and renewable energy information about it, including statistics, renewable resource maps, policies and incentives, and U.S. Department of Energy projects and activities.
EPA- Impacts on Water Resources in the Great Plains
Potential for Human Illness Associated with Blue-green Algae Blooms in Oklahoma Lakes
Blue-green algae are microscopic organisms naturally found in lakes, reservoirs and streams. Their numbers increase in warm, shallow, calm waters receiving abundant sunlight and nutrients (nitrogen, phosphorus).
4. Lesson Plans
Coping with Climate Change: 2 Texas Towns Struggle for Water
This lesson addresses the 2011 droughts in in two texas towns. It discusses how the higher temperatures have increased the evaporation from open reservoirs, resulting in a drop in their water levels. The use of water in fighting wildfires has also contributed to this drawdown. While some jurisdictions have been able to develop pipelines to other sources, others have had to resort to trucking water in.
Level: Middle 6-8, High School 9-12. College Lower, and Informal Direct Link ( This site may be offline. )
Wind Powering America
This is an activity that allows students to visualize a utility-scale, land-based, 80-meter wind map. It states, utilities, and wind energy developers use to locate and quantify the wind resource, identifying potentially windy sites within a fairly large region and determining a potential site's economic and technical viability.
Level: Middle 6-8 and High School 9-12 Direct Link (link may be unavailable)
5. Videos
EPA Releases New Climate Change Video Series / The Series Supports President Obama's Climate Action Plan and Highlights Benefits of Reducing Energy Consumption
The EPA released a series of videos that highlight how to lower energy consumption.
Disclaimer:
The National Climate Assessment regional resources for educators is written, edited, and moderated by each team of contributors. Posts reflect the views of the team themselves and not necessarily Climate.gov, NOAA, or USGCRP.
Contributors:
Contributors: Kristen Poppleton, Will Steger Foundation
Sarah Evans, Will Steger Foundation
References and Resources
Citation
NOAA, N. (2014). Great Plains: Energy, Water and Land Use - NCA Key Message 1. Retrieved from http://www.camelclimatechange.org/view/teachingunit/540df4280cf25fd1e4e3c1a2