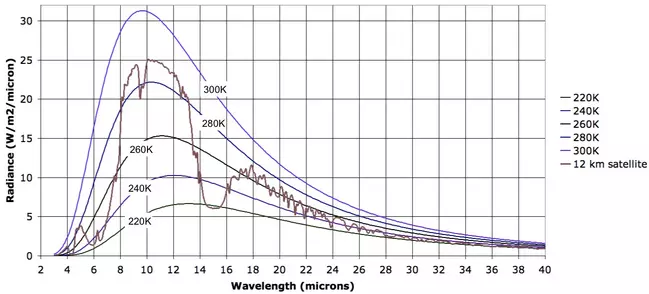
Absorption spectrum and blackbody spectra


View Original Image at Full Size

A modeled spectrum for Earth, measured at 12 km altitude (looking down), compared to blackbody emissions curves at various temperatures.
Originally uploaded in CLEAN:Teaching Climate and Energy:Tools for Educators:Workshops:Climate Workshop 2011:Workspace Pages.

Image 28550 is a 598 by 1320 pixel WebP
Uploaded: Jul15 11


Last Modified: 2011-07-15 14:44:38
Permanent URL: https://serc.carleton.edu/download/images/28550/absorption_spectrum_blackbody_.v2.webp

The file is referred to in 3 pages
Provenance
Data used in this figure are from SpectralCalc.com
Reuse
This item is offered under a Creative Commons Attribution-NonCommercial-ShareAlike license http://creativecommons.org/licenses/by-nc-sa/3.0/ You may reuse this item for non-commercial purposes as long as you provide attribution and offer any derivative works under a similar license.