Great Plains: Sustaining Agriculture - NCA Key Message 2
Summary

![[creative commons]](/images/creativecommons_16.png)
Key Message 2: Sustaining Agriculture
visit the full Sustaining Agriculture page
Changes to crop growth cycles due to warming winters and alterations in the timing and magnitude of rainfall events have already been observed; as these trends continue, they will require new agriculture and livestock management practices
1. Guiding Questions
- What new methods could be practiced to sustain agriculture in the Great Plains?
- How could impacts on agriculture productivity in the Great Plains affect the nation's food supply as a whole?
- What are two specific impacts on agriculture productivity from precipitation increases during the winter and spring?
2. Key figures
Increases in Irrigated Farmland in the Great Plains
Irrigation in western Kansas, Oklahoma, and Texas supports crop development in semiarid areas. Declining aquifer levels threaten the ability to maintain production. Some aquifer-dependent regions, like southeastern Nebraska, have seen steep rises in irrigated farmland, from around 5% to more than 40%, during the period shown. (Figure source: reproduced from Atlas of the Great Plains by Stephen J. Lavin, Clark J. Archer, and Fred M. Shelley by permission of the University of Nebraska.
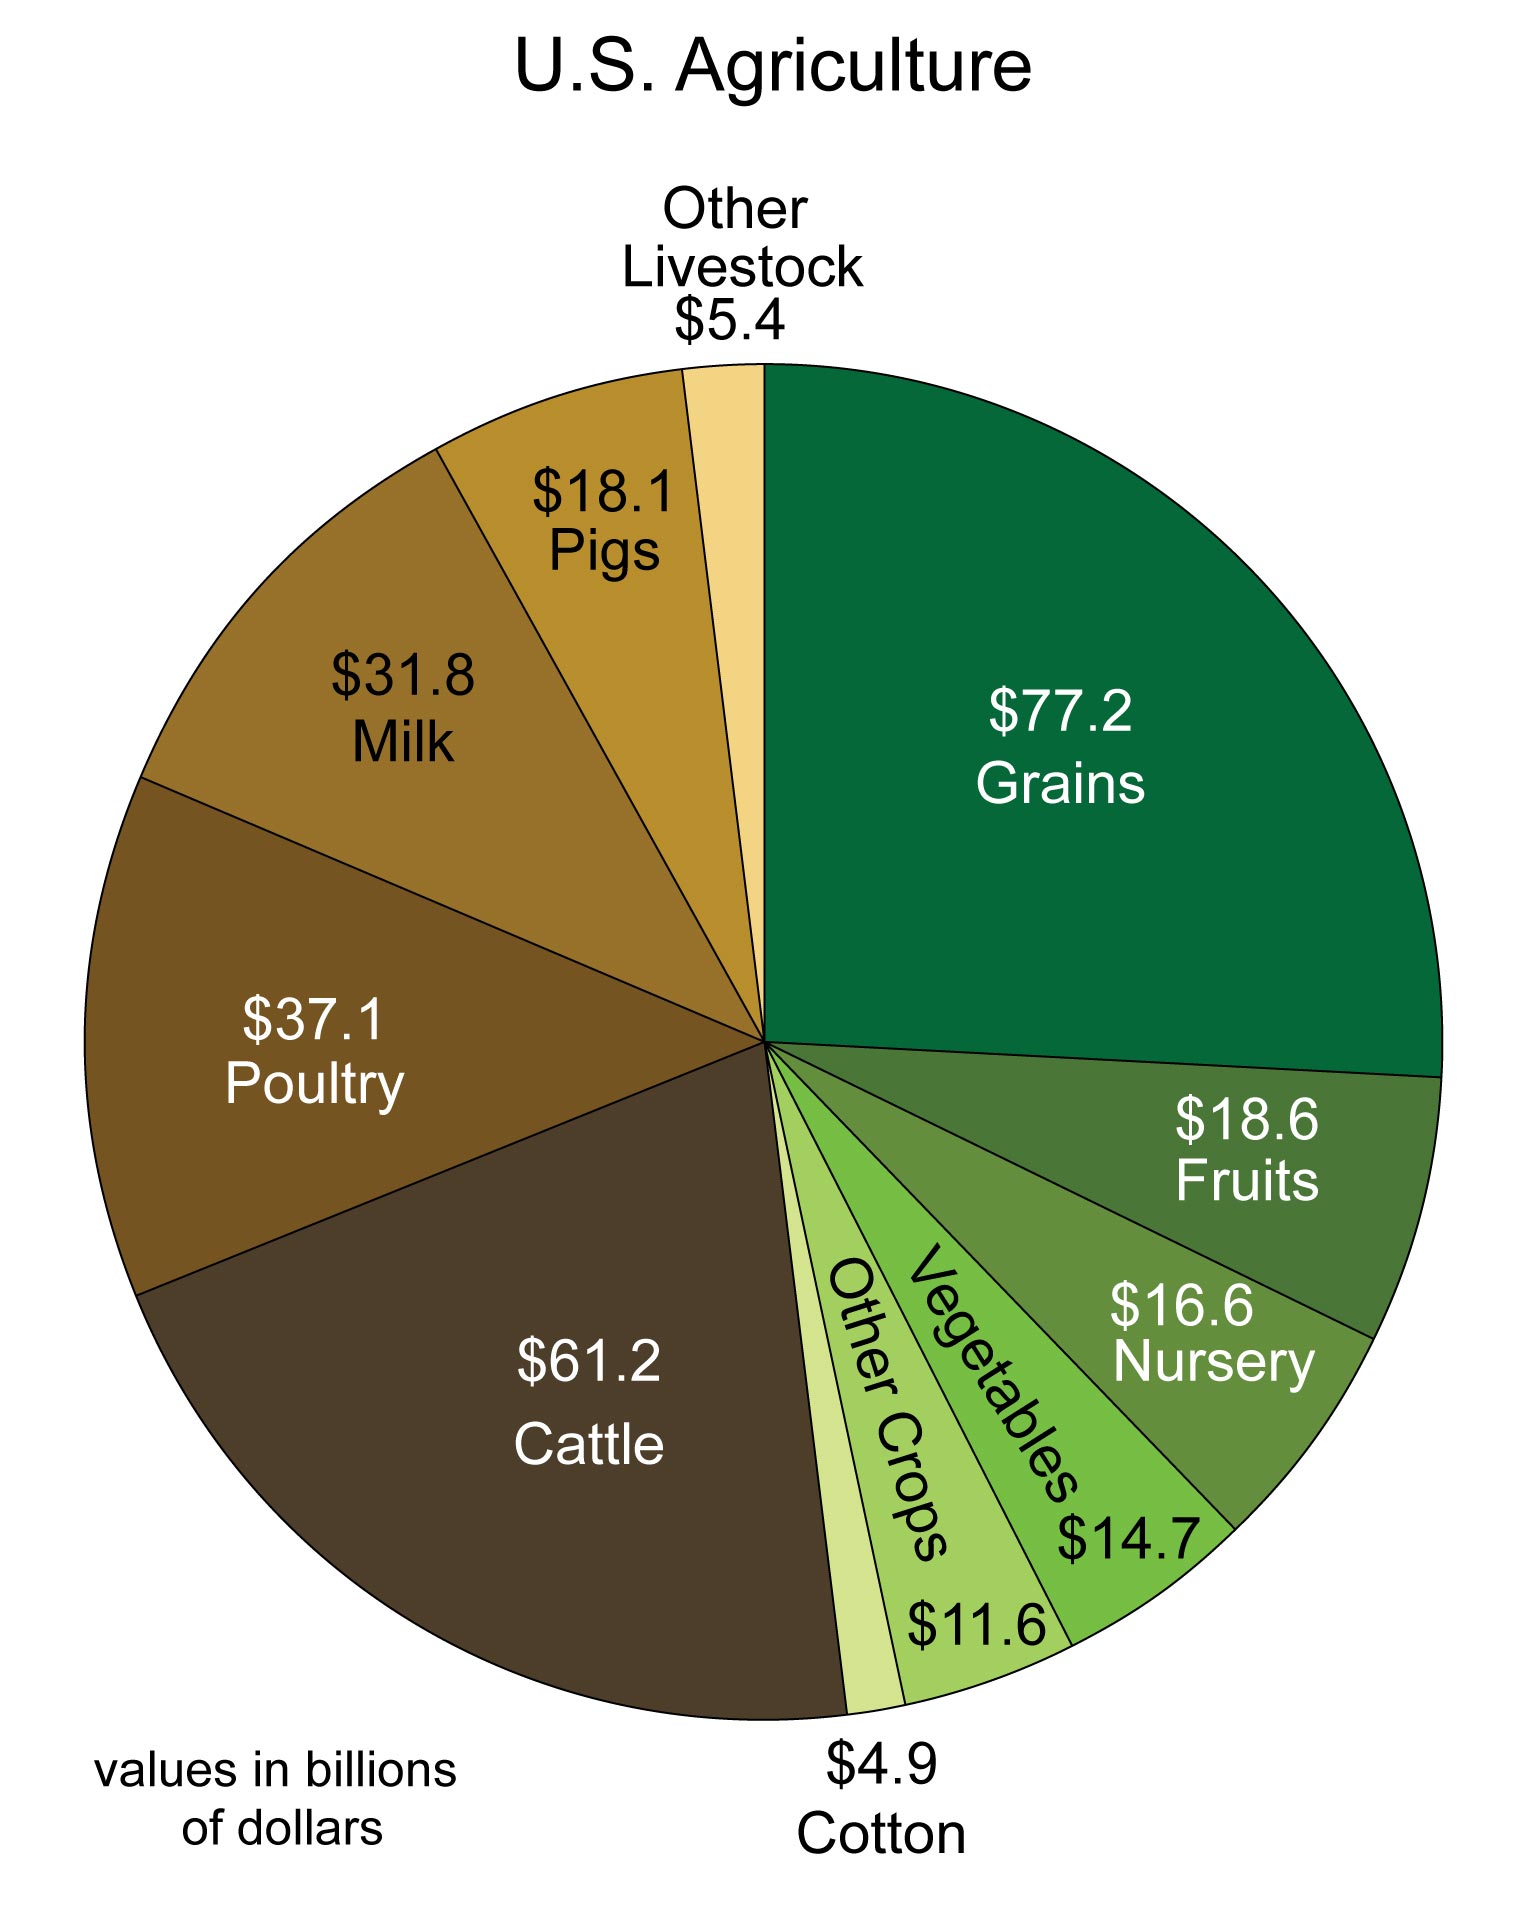
U.S. Agriculture
U.S. agriculture includes 300 different commodities with a nearly equal division between crop and livestock products. This chart shows a breakdown of the monetary value of U.S. agriculture products by category.
Agricultural Distribution
Agricultural activity is distributed across the U.S. with market value and crop types varying by region. In 2010, the total market value was nearly $330 billion. Wide variability in climate, commodities, and practices across the U.S. will likely result in differing responses, both in terms of yield and management. (Figure source: USDA National Agricultural Statistics Service 2008).
Projected Changes in Key Climate Variable Affecting Agricultural Productivity
Many climate variables affect agriculture. The maps above show projected changes in key climate variables affecting agricultural productivity for the end of the century (2070-2099) compared to 1971-2000. Changes in climate parameters critical to agriculture show lengthening of the frost-free or growing season and reductions in the number of frost days (days with minimum temperatures below freezing), under an emissions scenario that assumes continued increases in heat-trapping gases (A2). Changes in these two variables are not identical, with the length of the growing season increasing across most of the United States and more variation in the change in the number of frost days. Warmer-season crops, such as melons, would grow better in warmer areas, while other crops, such as cereals, would grow more quickly, meaning less time for the grain itself to mature, reducing productivity. Taking advantage of the increasing length of the growing season and changing planting dates could allow planting of more diverse crop rotations, which can be an effective adaptation strategy. On the frost-free map, white areas are projected to experience no freezes for 2070-2099, and gray areas are projected to experience more than 10 frost-free years during the same period. In the lower left graph, consecutive dry days are defined as the annual maximum number of consecutive days with less than 0.01 inches of precipitation. In the lower right graph, hot nights are defined as nights with a minimum temperature higher than 98% of the minimum temperatures between 1971 and 2000. (Figure source: NOAA NCDC / CICS-NC).
Projected Change in the Number of Consecutive Dry Days
Current regional trends of a drier south and a wetter north are projected to become more pronounced by mid-century (2041-2070 as compared to 1971-2000 averages). Maps show the maximum annual number of consecutive days in which limited (less than 0.01 inches) precipitation was recorded on average from 1971 to 2000 (top), projected changes in the number of consecutive dry days assuming substantial reductions in emissions (B1), and projected changes if emissions continue to rise (A2). The southeastern Great Plains, which is the wettest portion of the region, is projected to experience large increases in the number of consecutive dry day
3. Other Resources
USDA- Climate Change and Agriculture in the United States: Effects and Adaptation
Climate change effects over the next 25 years will be mixed. Continued changes by mid-century and beyond, however, are expected to have generally detrimental effects on most crops and livestock. As temperatures increase, crop production areas may shift to follow the temperature range for optimal growth and yield, though production in any given location will be more influenced by available soil water during the growing season. Weed control costs total more than $11 billion a year in the U.S.; those costs are expected to rise with increasing temperatures and carbon dioxide concentrations.
[link http://www.epa.gov/climatechange/impacts-adaptation/greatplains.html 'EPA- Impacts on Agriculture in the Great Plains
USDA- Climate Risks in the Southern Plains
This article addresses questions on climate change and production in the Southern plains.
USDA- Climate Risks in the Northern Plains
This article addresses questions on climate change and production in the northern plains.
4. Lesson Plans
U.S. Cropland Greenhouse Gas Calculator
In this activity students can use an interactive calculator that allows for estimations and visualizations on greenhouse gas production from croplands in the United States.
Level: High School 9- 12 and College Lower Direct Link
The Impact of a Global Temperature Rise of 4 Degrees Celsius
This lesson uses an interactive world map for students to see the impact of global temperature rise of 4 degrees celsius. This activity applies to agriculture, marine life, fires, weather patterns, and health. Students can click on the Hot Spots and see more specific issues in different regions
Level: Middle 6-8 and High School 9-12 Direct Link ( This site may be offline. )
5. Videos
USDA- Creating Modern Solutions for Environmental Challenges
Press Release: Secretary Vilsack Announces Regional Hubs to Help Agriculture, Forestry Mitigate the Impacts of a Changing Climate
Science for a Hungry World: Agriculture and Climate change (more info)
How will climate change impact agriculture? This episode explores the need for accurate, continuous and accessible data and computer models to track and predict the challenges farmers face as they adjust to a changing climate.
Climate Change and Soybean Research
USDA researchers are studying which soybean varieties react the best to a changing climate. For more information about soybeans and soybean research, please click on the following links.
Extreme Weather 101: Drought and Our Climate Change
Drought has left huge swaths of the United States parched this year. Are these dry conditions simply a fluke, or something we many need to get used to in a warming world? Scientist Mike Brewer and meteorologist Dan Satterfield explain the connection between drought and a changing climate in our series Extreme Weather 101.
Disclaimer:
The National Climate Assessment regional resources for educators is written, edited, and moderated by each team of contributors. Posts reflect the views of the team themselves and not necessarily Climate.gov, NOAA, or USGCRP.
Contributors:
Contributors: Kristen Poppleton, Will Steger Foundation
Sarah Evans, Will Steger Foundation
References and Resources
Citation
NOAA, N. (2014). Great Plains: Sustaining Agriculture - NCA Key Message 2.